When we look at a few Hubble photos of distant galaxies we may get the impression the universe is a static place. Other than the occasional supernova brightening, the galaxies we see haven’t changed much over the hundred years of observational history. But, it may well be the dynamics of energetic galactic collisions that created the variety of visually distinct galaxies we see today.
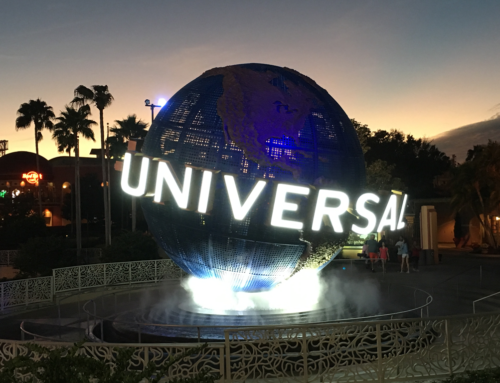
Though not so common today, images of many colliding galaxies, frozen in time, have been captured. In 2008, NASA and the Hubble Space Telescope Science Institute released a collection of 59 colliding galaxy images, shown above.
How do we explore this dynamics behavior, if it may take hundreds of millions of years for a collision to play out its course? The answer is by computer simulation.
In 1972, as a freshman in college, I watched, transfixed, as Alar Toomre, a professor of Mathematics at MIT, presented one of the weekly physics colloquia on the work he and his brother, Juri, had recently completed on simulating colliding galaxies.
This was the first time anyone had attempted so complex a calculation. They wrote their FORTRAN code based on nothing more complicated than Newtonian dynamics. But, this was the days of computer clock frequencies measured in kiloHertz, not GigaHertz. To simplify the calculations, they modeled a galaxy as a few hundred tiny masses orbiting around a large point mass.
Even with their simple approximations, they were able to send two galaxies toward each other, and view the detailed dynamics of how tidal forces disrupted the distribution of stars and gave rise to complexity such as spiral arms, bars, long tails extending off the ends and star bridges between the galaxies. An example from their first simulations is shown below.

They took screen shots of the positions of the star masses every few million simulated years and created a video. It was actually recorded on a 16 mm ASCII film recorder. The original video from 1972 was recently been rendered into a flash movie and can be viewed on the web here.
Since all the mass was assumed at the center, you can clearly see in their simulations the orbital speed of the stars decreasing radially from the center. The observation that the measured distribution of star velocities in real galaxies is typically constant with radius was one hint at a hidden distribution of dark matter.
Even with their gross approximations, it was remarkable that they could get such great correlation between simulated collisions and actual observations of known irregular galaxies. After this premier showing of his film, Alar Toomre received a standing ovation from the MIT audience.
Using more compute power and a refined model, here is a more recent example of the match between simulation and observation of colliding galaxies.

This actual photograph, on the left, is the Keenan system of colliding galaxies, taken by Adam Block. The image on the right is a still from a computer simulation by John Dubinski.
Below is one in a series of incredible simulations of various collisions in a galaxy cluster, created by Dubinsky and also available on his web site or on DVD.
In the last 40 years, the Toomre Sequence, as the evolutionary history of colliding galaxies has been called, has been matched to a variety of photographed galaxies. In the Hubble Atlas of Merging Galaxies, the stages in the Toomre Sequence are illustrated, comparing the simulated distributions of stars and gas with observations. The correlation between computer simulation and observation, shown below, is striking. In the images below, the screen shots from computer simulations are on the left and the Hubble photos of actual galaxies are on the right.


A similar comparison of computer simulations and observations was created and compiled into a video by Frank Summers and is shown below.
While we will never directly observe the dynamics of galactic collisions in real time, we now have the computer power to simulate a billion years of interactions and see how important galactic collisions are in shaping the distribution of sizes and shapes of galaxies we see today.
As of 2010, this power of simulation is available at everyone’s fingertips. To perform your own simulation of colliding galaxies on your computer, or to compare other simulations with actual observations of real galaxies, visit the Galaxy Zoo Mergers project, one of the programs associated with the Galaxy Zoo.